The Seotistics newsletter is written by Marco Giordano, a Data/Web Analyst with the goal of combining business and web data. Tired of the usual boring Analytics content without any business impact? Seotistics teaches you how to use Analytics, web data and even content in your workflow while helping you with Strategy.
📈 How To Use Data To Inform Your SEO Strategy
Use Data Or Be Used By Data!The July 24 issue of Seotistics is here for you! |
One of the biggest problems many have with SEO is using data to inform their strategy. Knowing Google Sheets formulas and Excel is not what actually makes the difference. But then, what does? I am telling you in this new issue of Seotistics. [I've released v4 of my ebook, check it out on Gumroad. The next update will be massive!] Please move this email to your Primary inbox (or reply to it). This is to prevent Seotistics goes into spam by accident. Gmail users can read this tutorial to do it. 📕 Understand the Business & The ProblemSEO is a vast industry and you can't compare a SaaS to an E-commerce just because "they are still websites". Both have different needs, KPIs and budgets. I always recommend specializing in something rather than being a generalist... for example, only working with B2B SaaS or B2C content websites. This makes it easier to frame down a problem and quicker when giving results.
A simple exercise could consist in writing down some questions that can help you in detecting the problem at hand. Some quick examples:
Some of them aren't relevant for some websites so you can safely ignore them. I always try to figure out what I am dealing with to see what moves the needle the most. Sometimes, there aren't many options and the only choice is testing. 💡 The Data ProcessingThis is the part where there are the most errors. You should always clean your data as I already mentioned in one of my past Seotistics issues. It's rule number 1 of every proper analysis. I can’t stress enough the importance of proper cleaning and understanding what to filter out. This is the most frequent error in SEO analyses because many forget to remove all the boilerplate pages or foreign queries. My recommendation is always the same: prepare a list with all the pages you usually filter out and improve it over time. I can already tell you that I love removing tags and categories because it’s often pointless to include them. 💡 The SEO InsightsInsights are what we are after and the main reasons why you read this newsletter. But getting them isn't all, you need to present them and convince people. This is where I made the most mistakes (and I still do). Attention is extremely limited nowadays and you should use ANY device to get it. No ifs and buts, just do it. If you have followed my threads and my past Seotistics issues, you’d know that there are plenty of ways to extract insights. Anyway, once you get going, you will notice that not everything is relevant. Technical SEO is where I see it happen the most. I’ve never understood why we should be wasting time on titles and descriptions when we have much more important information. To avoid following fake leads, you need clear objectives from the start AND to detect noise. This requires some practice and training since there are no general rules to follow. If you know what moves the needle in SEO, then this will be easier. 💡 The 3-minute Story + Big IdeaThese are 2 techniques I recommend to quickly express concepts. Big Idea: 1-2 sentences to explain the whole concept. 3-minute story: like the name implies, a relatively short story. You can learn more with this masterful book: Storytelling with Data. Bullet lists with 3 takeaways also do their job, like the one below:
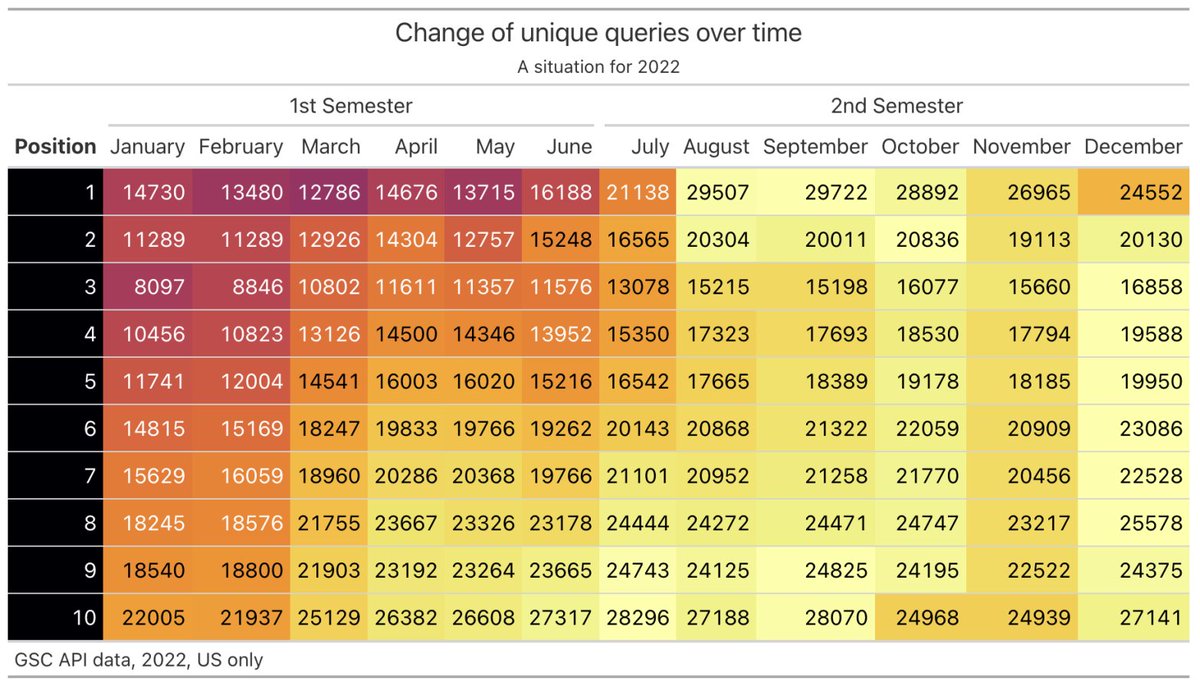
Something like this is more effective than all of the other formats you will see. Many people will never read what you have produced so it’s important to catch their attention early on. The table below is a great example, it's actually an embellished pivot table. The figure before was exactly the same as this, but formatting does miracles.
🏎 Ready...Go!!!The next step is eliciting action, or else your effort will be in vain. The 5 Whys is a nice technique to understand if you are going in the right direction. Remember, if you can’t find a connection, then it’s just a nice fact. For instance, if I claim that: 50 pages showed significant traffic loss (>50% drop compared to last year) This may be true and all and then what? How is your audience supposed to act based on this insight? There are many actions you can recommend, such as:
You see, there are many different paths you can take after 1 simple sentence. Of course, in practice, you would have investigated more but the idea is the same. You are tying one of your findings to an action. Do you even know how many times I’ve failed before realizing this “simple” fact? Everything you say should be ideally tied to some action OR make the situation more clear, so that you can help someone make decisions. If the website is a black box, you are progressively shedding light on it to uncover some aspects of reality. See? Easy, quick, and immediate. Another DataViz truth is about big numbers. You should have them to attract the attention of your audience. 10,000,000Big difference, right? Presenting your insights is half the battle to win consensus. ❌ The Most Common MistakesSome of the most common mistakes I noticed are as follows:
Some of them are also mathematical errors. You don’t have to be perfect but it’s stuff you can learn in little time. My advice is to document everything you can and keep track of how you extract the data for future reference. 🧵 My Selection Of Twitter ThreadsA quick recap for those who haven't read them all or need a refresher:
👥 👥 Join Our CommunityWe have launched our Discord community and I will contact every person who hasn't joined yet. Our goal is to encourage actual SEO testing and building meaningful connections.
🔎 Analytics For SEO Ebook (v4)This ebook is aimed at SEOs or Business Owners who want to explore the combination of SEO and Analytics. If you want to start building your data empire, this is the (initial) path to take. It will teach you or your employees to: 👉 Avoid common pitfalls that cost you money 💸 👉 Create meaningful analyses that add value 💯 👉 Shorten the learning time of Analytics ⏳ This comes with monthly updates because I want to create the Ultimate Guide out there. The v4 update includes the following new information: ✅ Generating Synthetic Data - Use Case 7 ✅ Financial Estimation (Introduction with R) - Use Case 8
v5 (2 weeks) will feature:
v6 (End of August) and will feature:
📚 Recommended ReadsThese Analytics books are among the best out there. If you want to think like a true Analyst, look no further. I know, I always recommend them, but now they are even more relevant especially the last one!
❗️ Feedback and RecommendationsIf you have ideas/recommendations for the next issues of Seotistics, you can simply reply to this email. Marco Giordano Follow me on 🔽🔽🔽: |

Bernerstrasse Süd 169, Zurich, Switzerland |
Seotistics - Web Analytics + Business + Strategy
The Seotistics newsletter is written by Marco Giordano, a Data/Web Analyst with the goal of combining business and web data. Tired of the usual boring Analytics content without any business impact? Seotistics teaches you how to use Analytics, web data and even content in your workflow while helping you with Strategy.
Use Data Or Be Used By Data! The March 30 issue of Seotistics is here for you! Claude Code is the absolute GOAT and today I will show you how to actually use it. Or well, what you need to start and avoid writing random prompts. If you are half-serious about Web Analytics, you can NOT skip Claude Code. AI is the divider: forget about learning GA4/GTM and call it a day. This issue will introduce you to the key concepts that we will cover deeply in the upcoming weeks. Please move this email to...
Use Data Or Be Used By Data! The March 23 issue of Seotistics is here for you! After a pleasant experience at MeasureCamp Milan, it's time to talk about new ideas and projects. In the last issue I mentioned what you can actually build today... now I give you even more ideas. Not all of them actually come from this Saturday but I will mention them anyway 😎 P.S. Check the very bottom as usual to find my presentation and ALL the resources. 👀 Please move this email to your Primary inbox or reply...
Use Data Or Be Used By Data! The March 16 issue of Seotistics is here for you! If you ever wondered whether you could get more proficient in Analytics with LLMs... this is for you! You absolutely can start with it. Not all that glitters is gold though... because many professionals and agencies are still doing it wrong. P.S. I've published a new article on the Minimal Web Analytics Stack For Small Businesses, go check it out 👀 Please move this email to your Primary inbox or reply to it. This...