The Seotistics newsletter is written by Marco Giordano, a Data/Web Analyst with the goal of combining business and web data. Tired of the usual boring Analytics content without any business impact? Seotistics teaches you how to use Analytics, web data and even content in your workflow while helping you with Strategy.
⚠️ Avoid These Mistakes When Visualizing SEO Data!
Use Data Or Be Used By Data!The June 19 issue of Seotistics is here for you! |
Have you ever looked at a dashboard and thought "This stuff doesn't make any sense". You are not the only one. Web Analytics and Marketing are infested by vanity metrics and useless dashboards. This issue will show you some basic mistakes to avoid. Please move this email to your Primary inbox. This is to prevent Seotistics goes into spam by accident. Gmail users can read this tutorial to do it. N.B. Last week I had problems sending you issue #7, so for those who missed it, you can read it here. 🔑 Key ConceptsLet's start with some basic definitions:
After reading this issue, you'll have a clear overview of what to avoid. You won't become the master of DataViz but you'll be above the average, which is also good. If you've always despised many Looker Studio dashboards, you are in the right place. 🧮 Actionable SEO Tip - Do The Right ThingYou have two choices in life: do wrong but cool things or do boring but correct things. Effective DataViz may be boring because it doesn't have to be glamorous. You can get the best of both worlds but again, effectiveness first. Consider these factors first:
In most cases, simple plots do the trick. You don't have to spend hours on it if your audience is "unsophisticated". Many Looker Studio dashboards want to be cool but not practical. Showing a lot of scorecards and line plots may sound logical but doesn't make any sense in practice. If I have to make a decision, I'd prefer an uncluttered view instead. This is why I don't use the Looker Studio dashboards you find online... I create them myself based on the requirements (if any). ❌ What To AvoidThese are the DataViz capital sins:
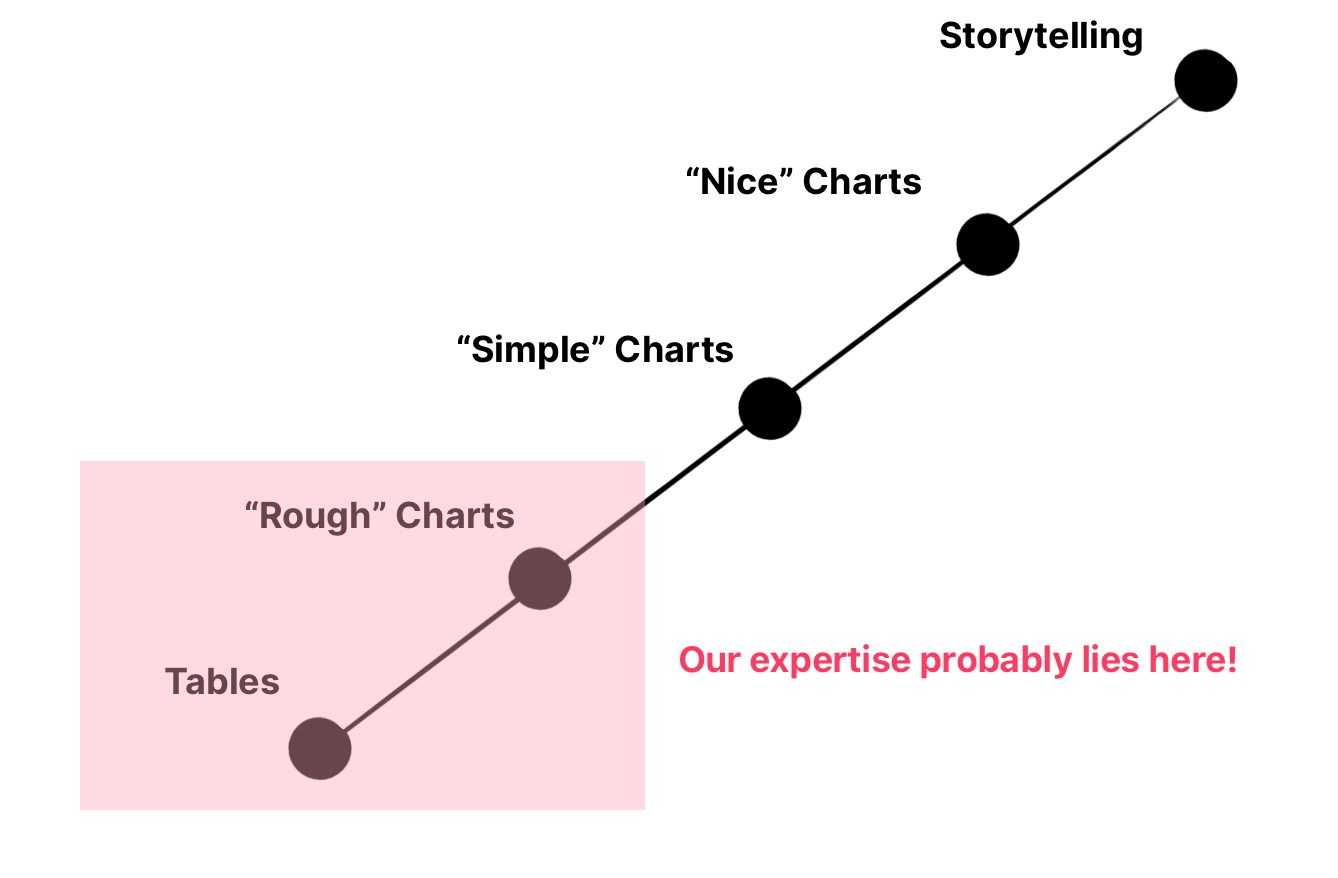
All of them are easy to avoid, do yourself a favor and learn them! The worst offenders are not starting the axes at 0 and misusing pie charts. How many dashboards have you seen with something like 10 pie charts!? Those are terrible to use... Think about what your audience may need to assess the situation or make a decision. P.S. Most of this stuff is covered in detail in the book I linked in Recommended Reads (and also mentioned below). ✅ What WorksThis is what works according to Knaflic’s Storytelling with Data (picture below adapted by Andrea d'Agostino in his article)
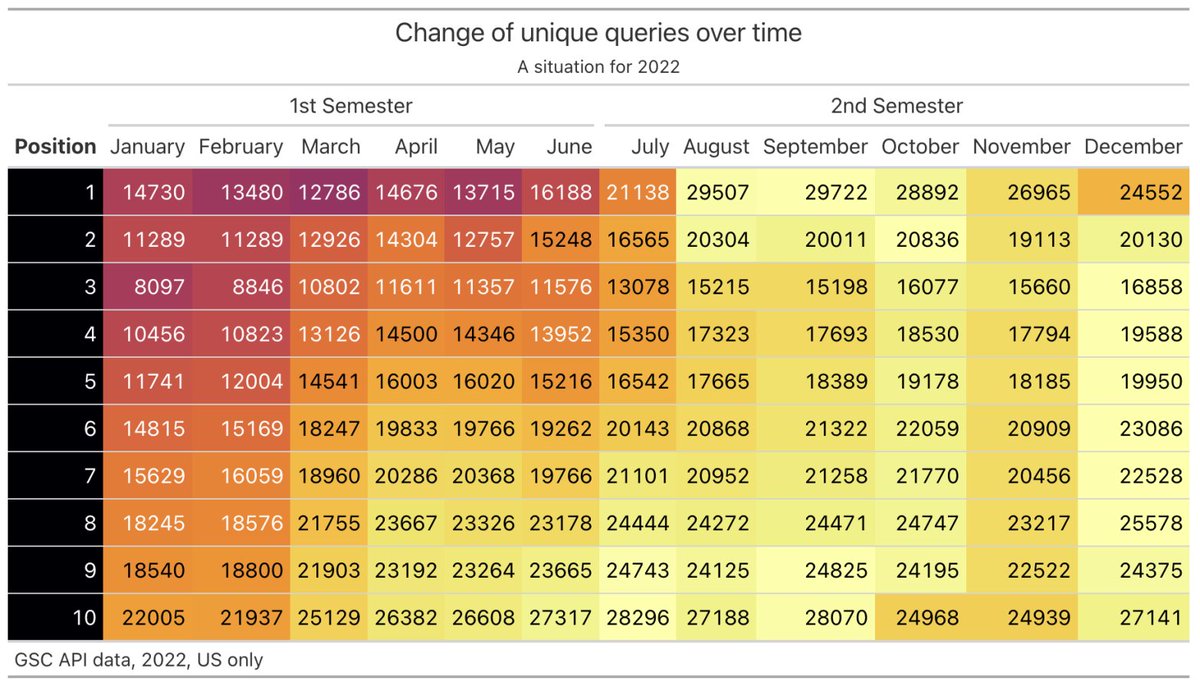
The heatmap is my favorite example as I keep bugging you all with this example below:
Effective plots reduce cognitive load, making sure your audience can quickly understand what's happening. In practice, a lot of executives want tables with conditional formatting and simple text. Barplots are another powerful tool because you can use them for pretty much anything. 🧠 Your Brain Is Playing Tricks On YouOur mind is flawed as we suffer from several biases. One of them is pareidolia, the capacity to spot a pattern when there is none. This is everpresent in DataViz and you have to think twice before you jump to conclusions. I recommend you actually inspect different subsets as well to go into depth. But that isn't all, there are multiple biases that affect our online behavior:
In plain English, proper DataViz should take into account some common issues we face as humans. Highlighting the correct elements and trying to be as neutral as possible are good solutions. Some of our findings can contrast our views and that can lead us to manipulate our data or ignore important insights. If you want the best overview of Neuroscience in Search and learn more about biases, you must consult Giulia Panozzo's website. 👈 ❌ My Personal Pet PeeveI really hate when SEOs post their unpolished plots because anyone can produce them. If you can tell where they come from, it's not something I would sell or present for serious reporting. Don't get me wrong, it's fine to use basic stuff for demonstrative purposes. But for commercial uses, I'd seriously consider spending 30 minutes on improving it. The "wow effect" is one of the most sought-out things by clients, for some reason. BUT and I say once again BUT... ... your plots should communicate something. Communication is the #1 requisite of DataViz, else you are simply producing cool stuff for the sake of it.
We don't need to be super good, but making some small adjustments can make our industry better. I learn every day because DataViz isn't even my first specialization but trust me, it's worth it! 💡 The SEO InsightsNow that you've read some DataViz theory, let's see how you can use all of this with SEO data: 👉 Avoid paying/using huge Looker Studio dashboards, focus on key metrics 👉 Think how a dashboard can give you actionable SEO tasks 👉 Be sure it doesn't require excessive maintenance Visualizing data is powerful because we are visual animals, after all. This brings other issues, such as being easily fooled by colors, patterns and shapes. If you want to speed up your SEO execution, you need to be extremely careful. This stuff is also powerful if you want to get backlinks by publishing original research. Create good plots/infographics and it'll rain backlinks! This is one of those cases where you need to be cool and effective at the same time. 🧵 My Selection Of Twitter ThreadsA quick recap for those who haven't read them all or need a refresher:
👥 Launching a Community (Join The Waitlist)We have launched our Discord community and I will contact every person who hasn't joined yet (starting from tomorrow). Our goal is to encourage actual SEO testing and building meaningful connections.
I am also considering using Twitter for communities... why not!? 🔎 Analytics For SEO Ebook (v3)This ebook is aimed at SEOs or Business Owners who want to explore the combination of SEO and Analytics. If you want to start building your data empire, this is the (initial) path to take. It will teach you or your employees to: 👉 Avoid common pitfalls that cost you money 💸 👉 Create meaningful analyses that add value 💯 👉 Shorten the learning time of Analytics ⏳ This comes with monthly updates because I want to create the Ultimate Guide out there. The May update includes the following new information: ✅ Detecting Keyword Cannibalization (The Actual One) - Use Case 6 ✅ Statistics 101 (Small Update) ✅ Updates For Use Cases 2 and 5 ✅ Introduction to R ✅ Brief Introduction to Joins (More in v4) ✅ N-grams and How You Can Use Them
v4 (End of June) will feature:
v5 (End of July) and will feature:
📚 Recommended ReadsThis topic requires dedication and a lot of time. I show you the best resources to get started now:
❗️ Feedback and RecommendationsIf you have ideas/recommendations for the next issues of Seotistics, you can simply reply to this email. Marco Giordano Follow me on 🔽🔽🔽: |


Bernerstrasse Süd 169, Zurich, Switzerland |
Seotistics - Web Analytics + Business + Strategy
The Seotistics newsletter is written by Marco Giordano, a Data/Web Analyst with the goal of combining business and web data. Tired of the usual boring Analytics content without any business impact? Seotistics teaches you how to use Analytics, web data and even content in your workflow while helping you with Strategy.
Use Data Or Be Used By Data! The July 13 issue of Seotistics is here for you! Scraping is one of the most important skills you must have as an analyst AND marketer. But what changed after LLMs? Well, a lot! This issue is about YOU scraping websites to get data, not how LLM providers scrape your website. Please move this email to your Primary inbox or reply to it. This is to prevent Seotistics goes into spam by accident. Gmail users can read this tutorial to do it. Read this in your browser 📣📣...
Use Data Or Be Used By Data! The July 6 issue of Seotistics is here for you! This is the last issue talking about LLM measurement. I will cover some of the last details because this topic has been covered a LOT. Then, I will start drafting one of the many articles I promised you 👀 If you are still postponing studying LLMs... I have bad news: they are everywhere. It's also true that AI Search as of now looks like Sci-Fi in terms of measurement (it doesn't exist yet). Please move this email to...
Use Data Or Be Used By Data! The June 29 issue of Seotistics is here for you! The last time we talked about AI measurement and what changed. Turns out a lot changed indeed! I will go deeper on some concepts that the last time weren't covered with due credit. P.S. Next week the last part of this series. Please move this email to your Primary inbox or reply to it. This is to prevent Seotistics goes into spam by accident. Gmail users can read this tutorial to do it. Read this in your browser 📣📣...